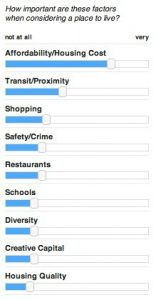
The New York magazine devoted its most recent issue to Neighborhoods and in the process of trying to decide which one was the most livable, they ran into some very interesting challenges. Unlike other rankings based on the opinion of an editorial group, they decided to arm themselves with as much information that would quantify different aspects of livability and create a model that would use it all to compute the results. Seems too algorithmic? Consider some of their sources: Yelp, StreetEasy, Zillow, US Census Bureau and the local government. In the age of open data, things like potholes, code violations, test scores at schools, crime rates, density of shopping alternatives, parks, noise levels and many more are all available to provide a robust foundation.  All of these get organized into broad priorities such as housing, transit, safety, schools, diversity, green space, etc. Don’t trust their formula to prioritize the various factors that affect livability? Try their Livability Calculator to set your own priorities.
What I find most useful about this approach is the recognition that open data can be built into dynamic tools that help us make better decisions. I’m not going to claim that we went through such an exhaustive process to define our features for our recent local guide, but I’m certain a healthy dose of live data would provide the ultimate planning tool. Not only stay up to date as new businesses appear and others close, but account for shifting preferences that make some venues more popular during the summer days, or the degree to which a venue is likeable in the various social media tools may soon be the norm for ranking places, in real time.


Pingback: the neighbourhood social network » Global Culture